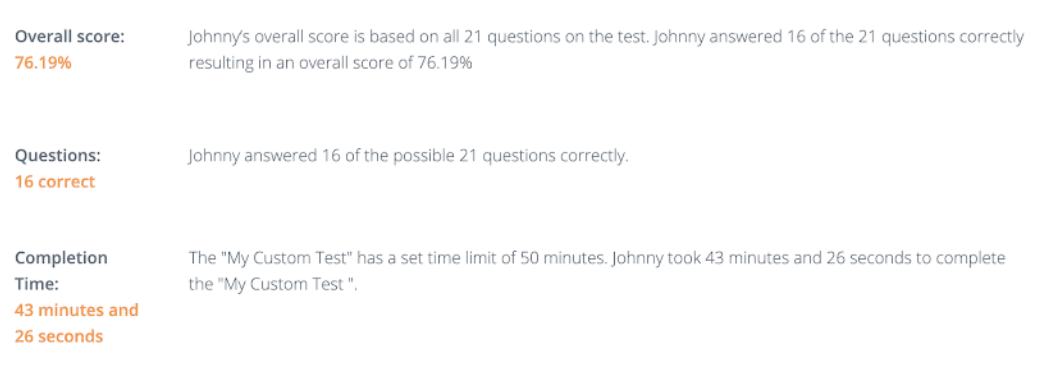
Sample Skills and Aptitude Test Summary Report
Sample Personality Profile Reports
Integrity Test
Aptitude Tests
If you’ve chosen to give one of our skills or aptitude tests as part of your pre-employment testing requirements, a summary report will be automatically generated and sent to you each time a test is submitted. The report provides a general overview of the job candidate’s test results, with information about the overall score, the weighted score, how many questions were answered correctly, and how long the person took to take the test (if applicable).
Reading the Sample Skills and Aptitude Test Report
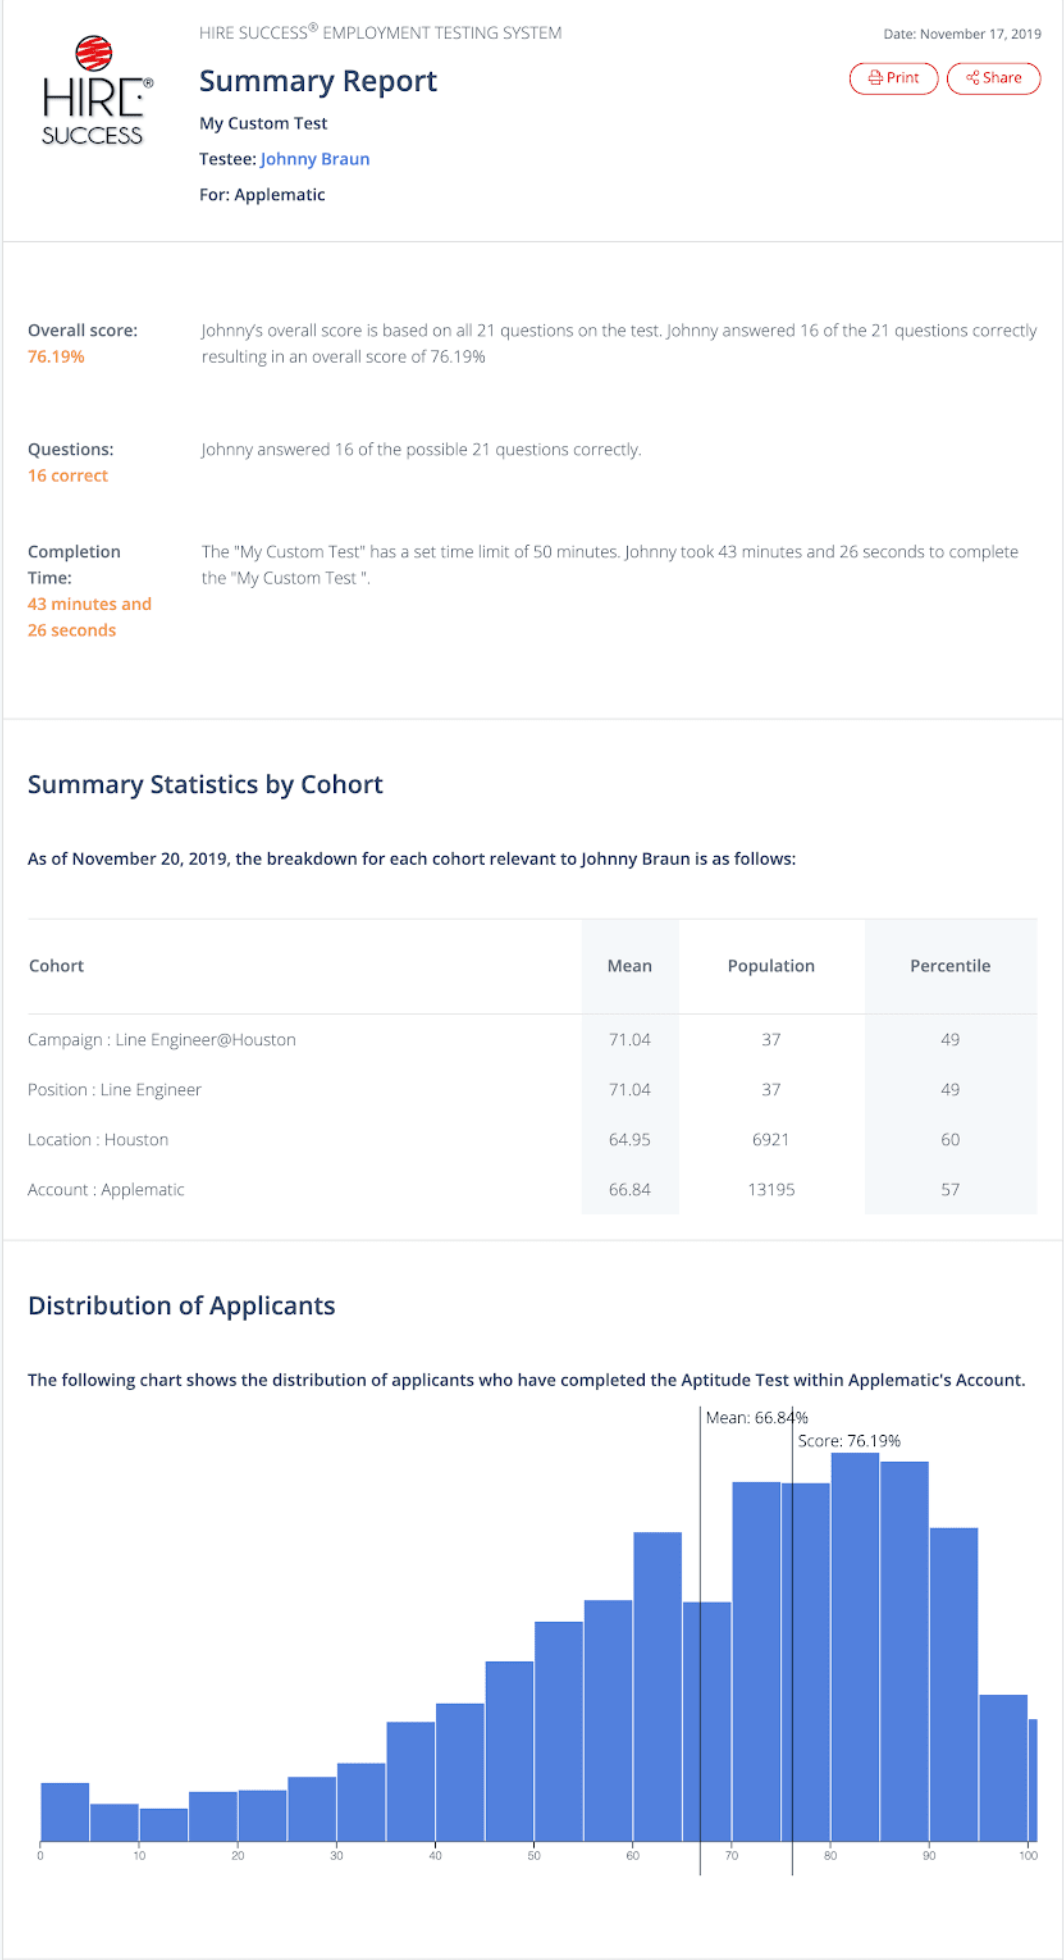
As seen in the sample aptitude test image shown here, the summary report starts by providing an overview of the candidate’s overall score, weighted score, and the number of questions answered correctly. The report then provides details about how the candidate scored by cohort — in other words, how the person scored in comparison with other candidates who took the test.
High-Level Summary of Aptitude Report
As you can see in the aptitude test sample, the high-level summary has three to four overview sections that provide information about the results of the candidate’s test:
- Overall score. Here you’ll see the person’s overall score, including the number of questions answered correctly and the overall percentage.
- Weighted score. If your test has weighted questions — in other words, if some questions are considered more important and are therefore given more weight (or points) than others — you’ll see the candidate’s weighted score here.
- Number of questions correct. Here you’ll see how many questions the candidate answered correctly, as well as the total number of questions on the test.
- Time to complete. If applicable, the report will provide information about how long it took the candidate to complete the skills test (in the sample aptitude test image above, this information is not included).
Summary Statistics by Cohort
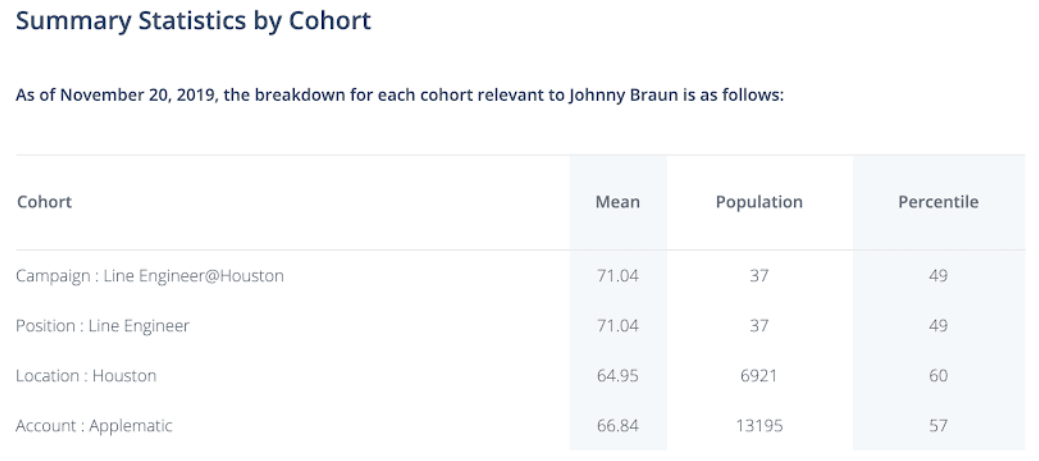
The Statistics by Cohort section provides important information about how the candidate’s score compares with others who took the same test in your current hiring campaign and/or previous campaigns.
In the example aptitude test here, you’ll see that the scores are also broken down by hiring campaign, position, and location (you may only have one location, hiring campaign, and/or position for reference). The initial cohort chart shows you the mean scores, population (number of test takers), and what percentile the candidate was in for each.
Distribution of Applicants

Following the summary statistics by cohort, the report provides a bar chart highlighting the applicant’s score and the mean score for all candidates who have taken this particular test. This chart helps you visualize just how the candidate compares with others in the same hiring campaign.
In the aptitude test sample given here, the candidate scored well above the mean, outperforming most of the test takers in the campaign.
Scores by Category
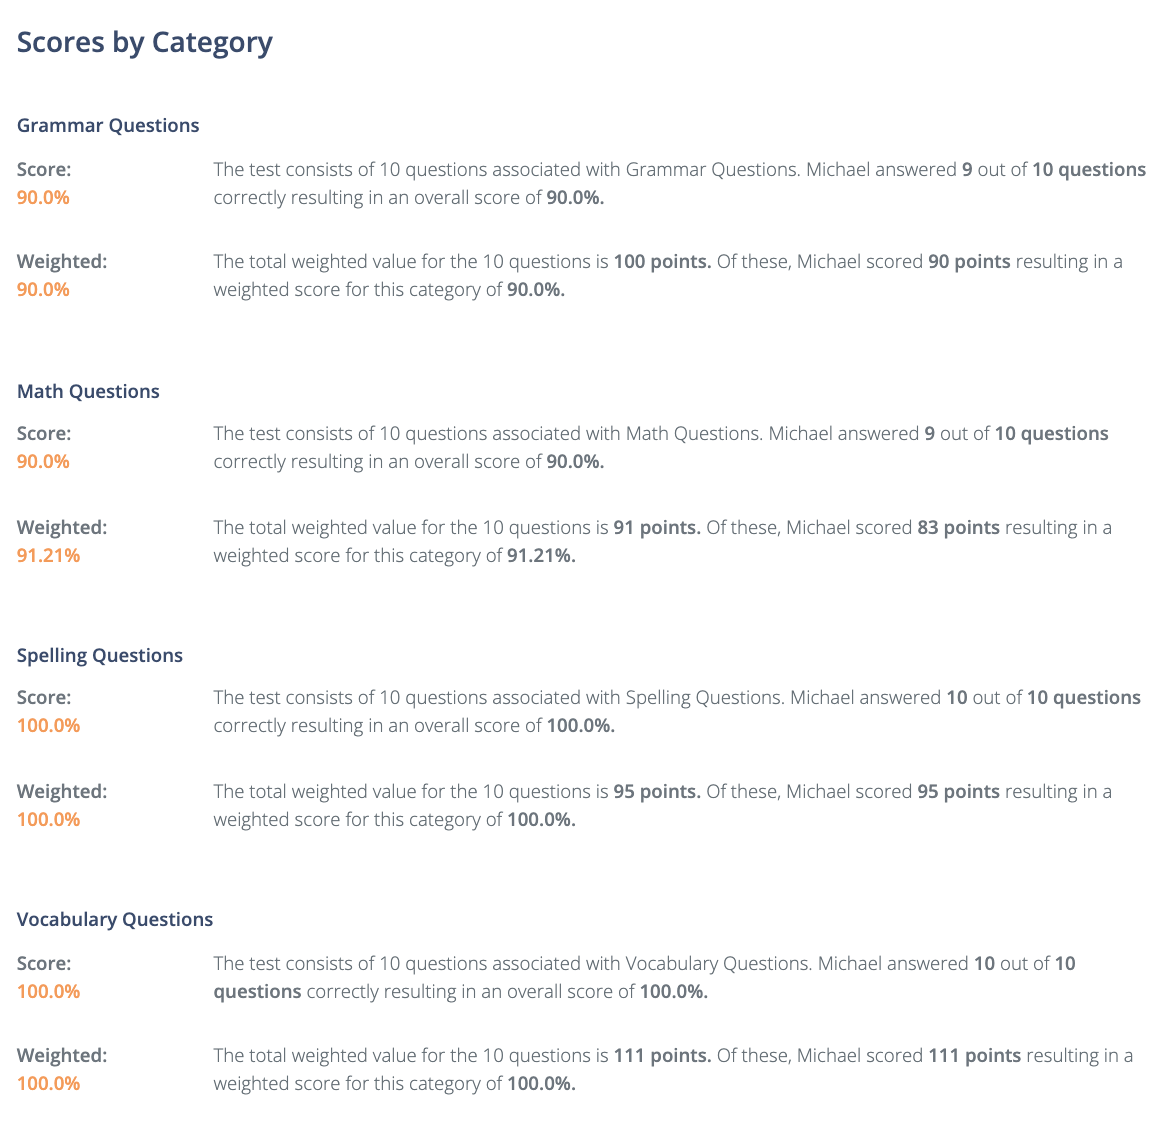
Finally, the Scores by Category section provides a breakdown of how the candidate scored in each area of the test. This section isn’t applicable or included in all skills and aptitude tests (for example, the spelling test focuses only on one topic), but for combination tests, this information can provide insight into a person’s particular strengths and weaknesses.
For instance, in the sample aptitude test provided here, you can see how the candidate scored on grammar, math, spelling, and vocabulary questions. While performing well in each area, the candidate was especially strong in spelling and vocabulary.
Return to the Hire Success® skills and aptitude tests page